

The SomerVision Numbers are the most-cited summary of the 547 policies and actions described in the plan as a whole. They capture specific goals related to housing production, open space, job creation, and other important topics.
The SomerVision 2030 public process started in 2009, and was adopted in 2012, but covers the years 2010-2030. Internal data collection for the SomerVision Numbers is done by using Certificates of Occupancy, which is a term used in building construction to indicate that people can occupy the building. SomerVision’s time frame is from 2010-2030, which means that although projects were permitted in 2010, they didn’t reach the occupancy and reporting stage until 2011.
We also encourage you to review our update report The Path Since 2010.
Jobs
SomerVision Number: 30,000 new jobs as part of a responsible plan to create opportunity for all Somerville workers and entrepreneurs.
During the SomerVision process, community members identified that Somerville residents leave in large masses every day to access job centers in other communities. This hurts our local squares that need a daytime population to thrive, burdens residents with a daily commute, and adds to regional traffic congestion. The 30,000 new jobs goal was created to provide access to jobs for our workforce population at a 1:1 ratio, meaning that for each working-age resident in Somerville there would also be one job.
According to internal data tracking, 7,491 jobs have been added between 2010 and 2020. We’ve reached 25% of our goal in half of the SomerVision timeframe. This growth is the result of over 2 million square feet of new commercial, lab, and retail development, of which the vast majority has occurred in transformational areas.
Job Creation Over Time
How is it calculated? We use industry standards to calculate how many jobs could fit in new development. For every 500 square feet of new retail space, we estimate one job has been added. For office space, we estimate one job per 200 square feet and for laboratory space, we estimate one job per 440 square feet. Each development in the city is tracked for these types of spaces to create our tally of jobs added.
Job Creation Map
Acres of Open Space
SomerVision Number: 125 new acres of publicly-accessible open space as part of our realistic plan to provide high-quality and well-programmed community space.
Somerville has the least open space per capita in Massachusetts, which to some degree is expected given that it is also the most densely-populated area in New England. The Steering Committee members, knowing the important health and recreation benefits that open space provides, set an ambitious goal of 125 new acres of open space.
A little over 15 acres have been created since 2011, representing 12% progress towards our SomerVision Number. There is an additional 4.9 acres of open space in progress at ArtFarm, Powder House Park, and 217 Somerville Avenue and the Community Path Extension. New development in transformational areas has been permitted and will include over 3.5 acres coming online throughout the buildout process in Union Square and Boynton Yards. In addition to adding acreage, the administration has focused on renovating existing parks and schoolyards. About 50 parks have been renovated to today’s standards during Mayor Curtatone’s administration, including Prospect Hill Park and Allen Street Playground (coming online late Fall 2020).
Open Space Growth Over Time
Open Space Growth Map
[Note: This map is missing the publicly-accessible open space at the Millbrook residences and Partner’s Healthcare Campus. To be added soon.]
Housing Units
SomerVision Number: 6,000 new housing units – 1,200 permanently affordable – as part of a sensitive plan to attract and retain Somerville’s best asset: its people.
The SomerVision number for new housing units felt ambitious at the time because of the Great Recession. Since then, urban living has become more widely desirable among baby boomers and millennials alike. This increasing demand, along with a strong economy and inadequate housing production, have made living in cities like Somerville more expensive than ever.
Over 2,000 new housing units have been created since 2011, 411 of which are affordable. This bring us 1/3 of the way towards our goal with significant housing development anticipated in 2021 with large buildings in Assembly Square coming online.
Housing Unit Creation Over Time
Affordable Housing Unit Creation Over Time
Housing Unit Creation Map
[Note: The map does not reflect units created through the 100 Homes Program.]
Sustainable Trips
SomerVision Number: 50% of new trips via transit, bike, or walking as part of an equitable plan for access and circulation to and through the City.
This SomerVision Number was designed to ensure that new development would not cripple the city with traffic congestion, but instead encourage healthier, more sustainable transportation behaviors from the residents and employees of new housing and commercial space.
Because this target was structured to consider the share of trips generated by new development, it has not been measurable for the majority of the time since SomerVision’s adoption. Tracking changes in travel behavior can be complicated unless new development is required to report how residents and employees of new buildings travel to and from home or work on an annual basis.
The newly adopted Somerville Zoning Ordinance requires Transportation Demand Management Plans (aka Mobility Management Plans) for new development in overlay districts which are mapped in transformational areas of the city. Property owners in these areas have started to implement their approved mobility management plans, including the recording of data on how people travel to and from these buildings. After a period of data collection, changes in travel behavior can be analyzed in comparison to Census Data to determine whether we are reaching this SomerVision Number.
While this data is still being gathered, we can look at other markers to determine if we’re headed in the right direction, including car ownership rates, new infrastructure, and transit ridership.
Bike Infrastructure Growth Over Time
Car Ownership Over time
[Note: Registered passenger vehicles are determined from City Excise Tax Records and vehicles per household are estimated based on households reported in the Decennial U.S. Census and American Community Survey One-Year Estimates.]
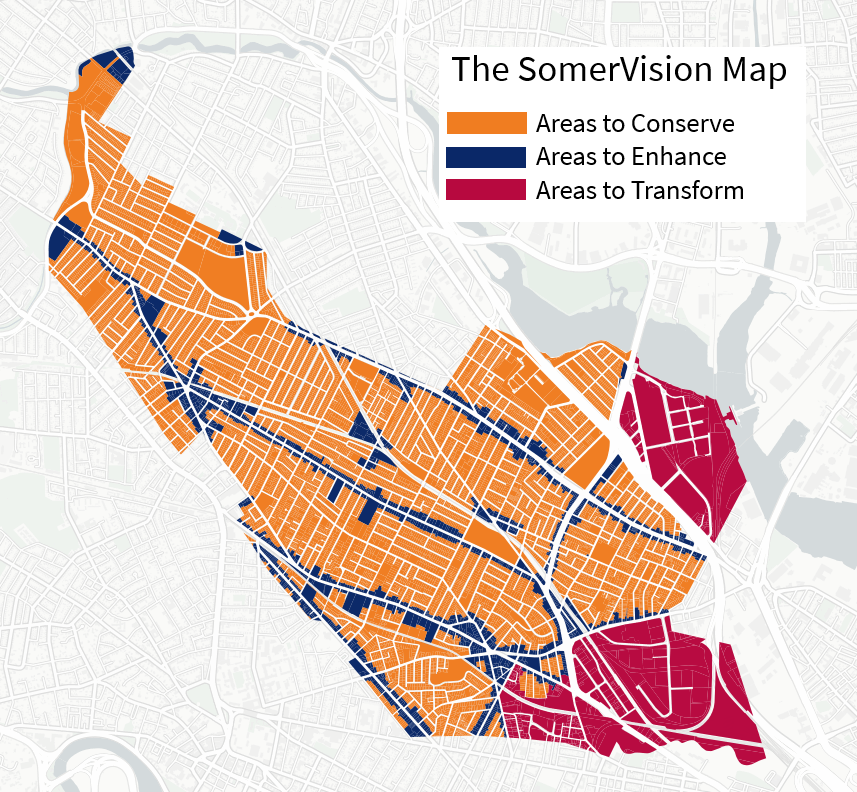
Transformative Development
SomerVision Number: 85% of new development in transformative areas as part of a predictable land use plan that protects neighborhood character.
One key theme of SomerVision 2030 is the need to preserve what’s great about Somerville while still encouraging mixed-use, transit-oriented development in strategically selected areas to support our job and housing goals. The SomerVision Number summarizes that priority by setting a target of 85% of new development in transformative areas.
According to internal data tracking, 5.5 million square feet have been developed, of which 3.7 million have been in transformational areas. This means 65% of development since 2010 has occurred in transformational areas. 90% of SomerVision jobs and 53% of SomerVision housing units have been developed in transformational areas. The majority of new development has taken place in Assembly Square with commercial development in Northpoint coming online.
Assembly Square, Union Square, and to some extent Boynton Yards are poised to absorb additional development within SomerVision’s timeframe. Other transformational areas need neighborhood planning (see SomervilleByDesign.com) before zoning is put in place to facilitate the development that the community would like to see.
Transformative Development Over Time